empty
27.01.2025 08:07 AM
EUR/USD and GBP/USD on January 27 - Technical Analysis of the Situation

EUR/USD

This image is no longer relevant

Higher Timeframes

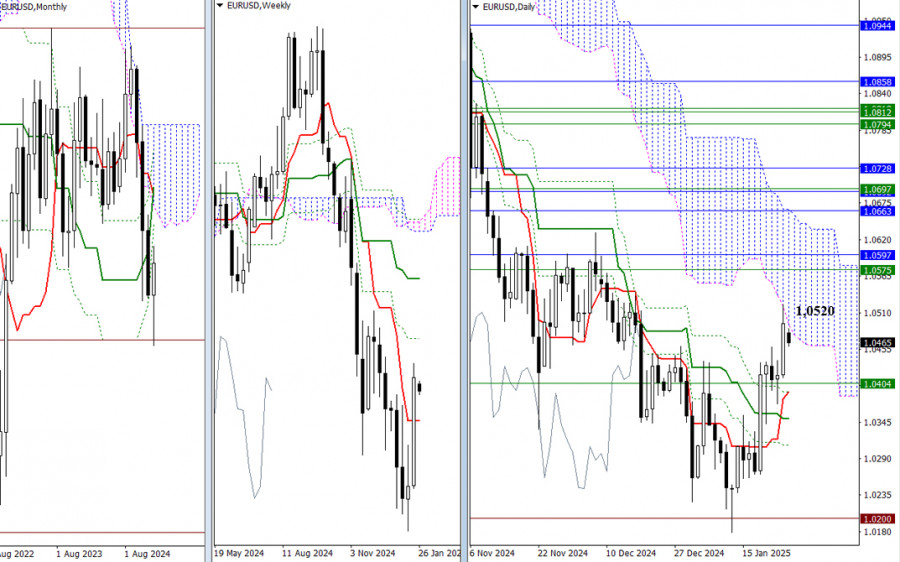
By the end of last week, the bulls successfully tested the lower boundary of the daily Ichimoku cloud at 1.0520. To maintain their gains and create new opportunities, they need to overcome the current resistance and penetrate the daily cloud. The next targets for further growth are the levels from the weekly timeframe at 1.0575 and the monthly timeframe at 1.0597. However, it's important to note that a downward gap formed at the market's opening today. Bullish scenarios should only be considered after the gap is closed and the price stays above the current levels. In the meantime, bears might use this gap to strengthen their positions and push the pair lower. The nearest downside targets are in the zone of 1.0404 to 1.0391, which aligns with both the weekly short-term trend and the daily short-term trend.

This image is no longer relevant

H4 – H1

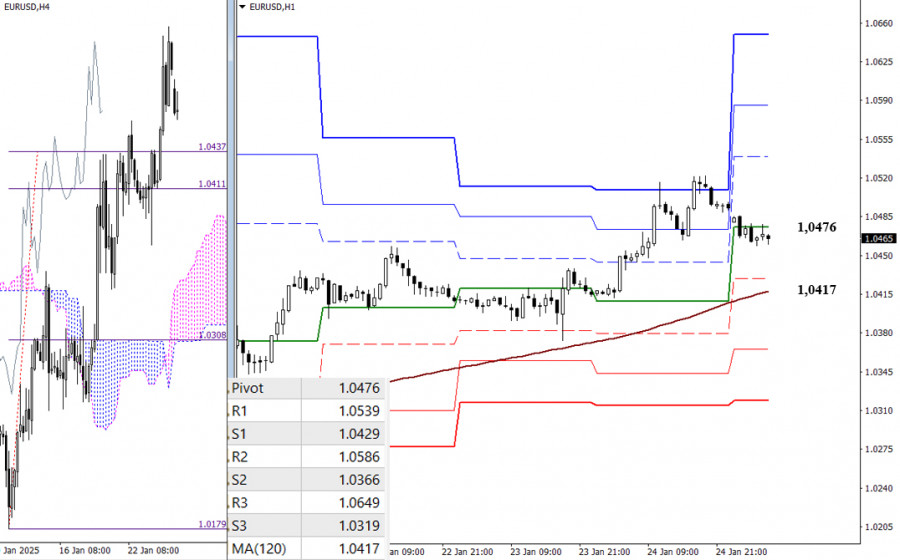
Currently, bulls have the upper hand on lower timeframes. However, the pair is experiencing a corrective downward movement, influenced by the daily central Pivot Point at 1.0476. If this correction continues, the market could test the weekly long-term trend at 1.0417, which plays a crucial role in determining the balance of power. A breakout and reversal of this trend could lead to stronger bearish momentum. Additional intraday support levels, based on classic Pivot Points, are found at 1.0429, 1.0366, and 1.0319. Resistance levels are identified at 1.0539, 1.0586, and 1.0649.

***

GBP/USD

This image is no longer relevant

Higher Timeframes

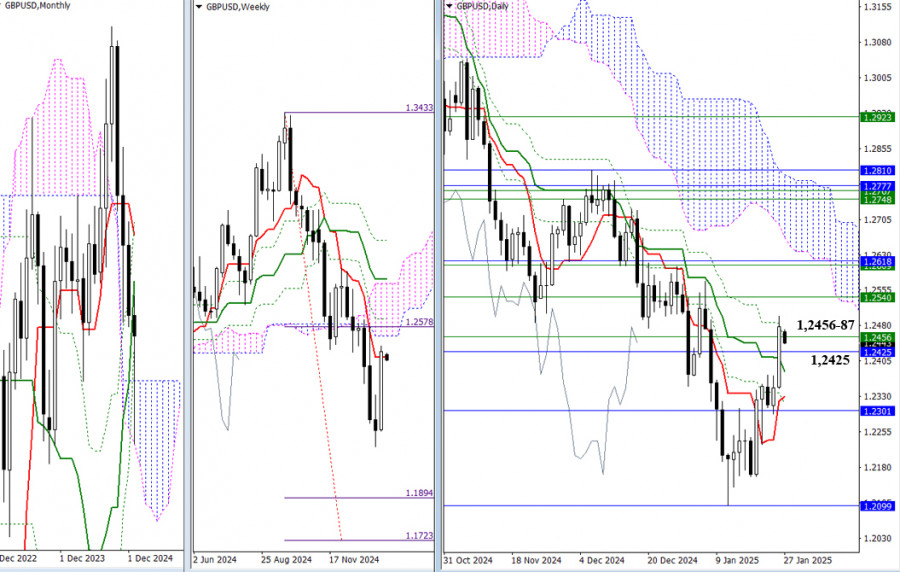
The final trading week of January has begun, raising the question of whether the bulls can maintain the long lower shadow on the monthly candlestick. If conditions remain favorable, they might even turn the candle body bullish. Last week, the pair experienced a corrective rise toward the resistance levels of 1.2425, 1.2456, and 1.2487. Breaking through these levels would enable the bulls to achieve key objectives: eliminate the daily dead cross and secure support from the weekly short-term trend. Conversely, if a rebound occurs from the resistance, the bears will likely target the monthly Ichimoku cloud, with its upper boundary at 1.2301. To do this, they will need to break through the support of the daily cross at 1.2382 and 1.2330.

This image is no longer relevant

H4 – H1

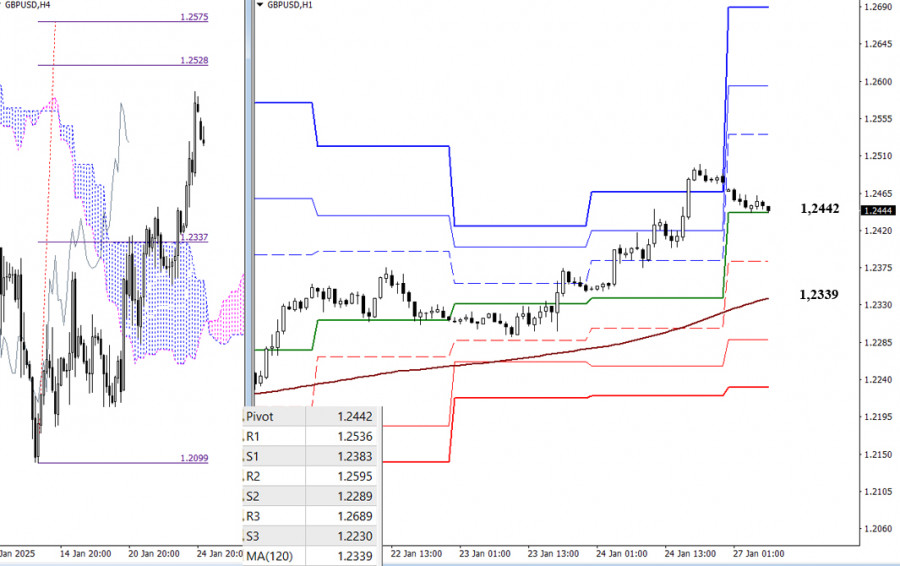
On the lower timeframes, the bulls have the main advantage. Their intraday targets include the classic Pivot Point resistance levels at 1.2536, 1.2595, and 1.2689, as well as the breakout target of the H4 Ichimoku cloud located between 1.2528 and 1.2575.

If the current correction deepens, the bears will aim to break below the central Pivot Point at 1.2442 and move toward the weekly long-term trend level at 1.2339. A break of this level would give the bears a significant advantage on the lower timeframes. Additional bearish targets for the day are the classic Pivot Point support levels at 1.2383, 1.2289, and 1.2230.

***

Technical Analysis Components:
  • Higher Timeframes: Ichimoku Kinko Hyo (9.26.52) and Fibonacci Kijun levels
  • H1: Classic Pivot Points and 120-period Moving Average (weekly long-term trend)
Evangelos Poulakis,
انسٹافاریکس کا تجزیاتی ماہر
© 2007-2025
ٹائم فریم منتخب کریں
5
منٹ
15
منٹ
30
منٹ
1
گھنٹہ
4
گھنٹے
1
دن
1
ہفتہ
انسٹافاریکس کے ساتھ کرپٹو کرنسی کی معاملاتی تبدیلیوں سے کمائیں۔
میٹا ٹریڈر 4 ڈاؤن لوڈ کریں اور اپنی پہلی ٹریڈ کھولیں۔
  • چانسی ڈیپازٹ
    اپنے اکاؤنٹ میں 3000 ڈالر جمع کروائیں اور حاصل کریں$1000 مزید!
    ہم فروری قرعہ اندازی کرتے ہیں $1000چانسی ڈیپازٹ نامی مقابلہ کے تحت
    اپنے اکاؤنٹ میں 3000 ڈالر جمع کروانے پر موقع حاصل کریں - اس شرط پر پورا اُترتے ہوئے اس مقابلہ میں شرکت کریں
    مقابلہ میں شامل ہوں

تجویز کردہ مضامین

فروری 13-16 2025 کے لیے سونے (ایکس اے یو / یو ایس ڈی) کے لیے تجارتی سگنل: $2,905 سے اوپر خریدیں (21 ایس ایم اے - 6/8 مرے)

ایچ 4 چارٹ کے مطابق، سونا اپنی تیزی کی طاقت دکھا رہا ہے کیونکہ قیمت 21 ایس ایم اے سے اوپر واقع ہے، جو مزید اضافے کا مرحلہ طے کرتی

Dimitrios Zappas 16:04 2025-02-13 UTC+2

فروری 13-16 2025 کے لیے یورو / یو ایس ڈی کے لیے تجارتی اشارہ: 1.0335 سے اوپر خریدیں (21 ایس ایم اے - 200 ای ایم اے)

اگر قیمت اگلے چند گھنٹوں میں 1.0335 سے اوپر مستحکم ہو جاتی ہے، تو یورو زمین حاصل کر سکتا ہے۔ تکنیکی طور پر، بیئرش ٹرینڈ چینل کا شدید وقفہ ہوا۔

Dimitrios Zappas 15:58 2025-02-13 UTC+2

13-16 فروری 2025 کے لیے بٹ کوائن (بی ٹی سی / یو ایس ڈی) کے لیے تجارتی اشارہ: $95,000 سے اوپر خریدیں یا $98,995 سے کم فروخت کریں (21 ایس ایم اے - 200 ای ایم اے)

دوسری طرف، جب تک قیمت $98,900 سے نیچے رہے گی، کسی بھی تکنیکی اچھال کو فروخت کرنے کے موقع کے طور پر دیکھا جائے گا۔ بی ٹی سی کی مختصر

Dimitrios Zappas 15:54 2025-02-13 UTC+2

نیس ڈیک 100 انڈیکس کی ڈیلی پرائس موومنٹ کا تکنیکی تجزیہ، جمعرات 13 فروری 2025۔

اگرچہ فی الحال اس کے یومیہ چارٹ پر Nasdaq 100 انڈیکس اب بھی اوپر کی طرف بڑھ رہا ہے جہاں اس کی اس حرکت سے تصدیق ہوتی

Arief Makmur 12:27 2025-02-13 UTC+2

فروری 12-15 2025 کے لیے سونے (ایکس اے یو / یو ایس ڈی) کے لیے تجارتی سگنل: $2,880-2,907 سے نیچے فروخت (21 ایس ایم اے - تصحیح)

اگر اگلے چند گھنٹوں میں مندی کا رجحان برقرار رہتا ہے، تو ہم توقع کرتے ہیں کہ سونا 2,857 کے قریب تیزی کے رجحان کے چینل کے نیچے تک پہنچ

Dimitrios Zappas 17:27 2025-02-12 UTC+2

فروری 12-15 2025 کے لیے یورو / یو ایس ڈی کے لیے تجارتی سگنل: 1.0384 - 1.0410 سے نیچے فروخت کریں (21 ایس ایم اے - 5/8 مرے)

یورو / یو ایس ڈی 1.0300 پر کلیدی سپورٹ سے اپنی بحالی جاری رکھے ہوئے ہے۔ تاہم، تکنیکی نقطہ نظر مندی کا شکار ہے کیونکہ یہ ٹرینڈ چینل کے اندر

Dimitrios Zappas 17:20 2025-02-12 UTC+2

فروری 11-15 2025 کے لیے سونے (ایکس اے یو / یو ایس ڈی) کے لیے تجارتی سگنل: $2,880 سے اوپر خریدیں (21 ایس ایم اے - واپسی)

دوسری طرف، اگر سونا اگلے چند گھنٹوں میں 2,932 کی ریزسٹنس تک پہنچ جاتا ہے، تو اسے فروخت کی پوزیشنیں دوبارہ شروع کرنے کے موقع کے طور پر دیکھا

Dimitrios Zappas 18:37 2025-02-11 UTC+2

فروری 11-15 2025 کے لیے یورو / یو ایس ڈی کے لیے تجارتی اشارہ: 1.0384 سے نیچے فروخت (21 ایس ایم اے - 5/8 مرے)

اگر یورو موجودہ قیمت کی سطحوں پر مستحکم ہوتا رہتا ہے، تو توقع کی جاتی ہے کہ یورو / یو ایس ڈی مندی کا سلسلہ جاری رکھے گا۔ لہذا،

Dimitrios Zappas 18:34 2025-02-11 UTC+2

فروری 10-12 2025 کے لیے بٹ کوائن (بی ٹی سی) کے لیے تجارتی سگنل: $96,000 سے اوپر خریدیں (200 ای ایم اے - 3/8 مرے)

اس کے برعکس، اگر بٹ کوائن اپنی تکنیکی تصحیح کو جاری رکھتا ہے اور 93,750 سے نیچے مستحکم ہوتا ہے، جو کہ مضبوط حمایت کی نمائندگی کرتا ہے،

Dimitrios Zappas 15:56 2025-02-10 UTC+2

فروری 10-12 2025 کے لیے یورو / یو ایس دی کے لیے تجارتی سگنل: 1.0376 سے نیچے فروخت کریں (21 ایس ایم اے - 200 ای ایم اے)

ممکنہ عالمی تجارتی جنگ پر بڑھتے ہوئے تناؤ کے ساتھ، امریکی ڈالر مضبوط ہو رہا ہے اور بدلے میں، یورو / یو ایس ڈی پر دباؤ ڈال رہا ہے۔

Dimitrios Zappas 15:54 2025-02-10 UTC+2
ابھی فوری بات نہیں کرسکتے ؟
اپنا سوال پوچھیں بذریعہ چیٹ.
Widget callback
 

Dear visitor,

Your IP address shows that you are currently located in the USA. If you are a resident of the United States, you are prohibited from using the services of InstaFintech Group including online trading, online transfers, deposit/withdrawal of funds, etc.

If you think you are seeing this message by mistake and your location is not the US, kindly proceed to the website. Otherwise, you must leave the website in order to comply with government restrictions.

Why does your IP address show your location as the USA?

  • - you are using a VPN provided by a hosting company based in the United States;
  • - your IP does not have proper WHOIS records;
  • - an error occurred in the WHOIS geolocation database.

Please confirm whether you are a US resident or not by clicking the relevant button below. If you choose the wrong option, being a US resident, you will not be able to open an account with InstaForex anyway.

We are sorry for any inconvenience caused by this message.