


signal strength 2 of 5
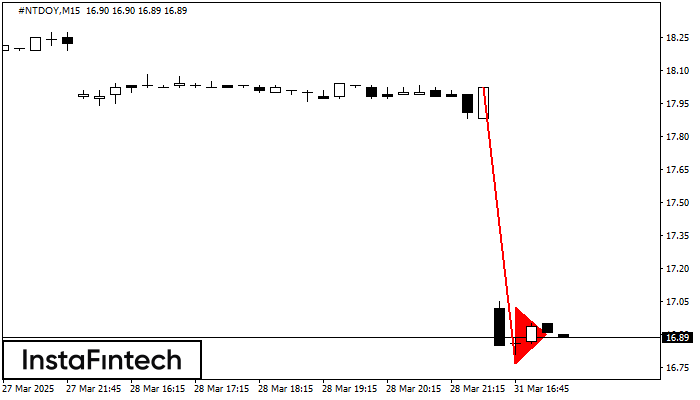
The Bearish pennant pattern has formed on the #NTDOY M15 chart. The pattern signals continuation of the downtrend in case the pennant’s low of 16.77 is broken through. Recommendations: Place the sell stop pending order 10 pips below the pattern’s low. Place the take profit order at the projection distance of the flagpole height.
The M5 and M15 time frames may have more false entry points.
یہ بھی دیکھیں
- All
- Double Top
- Flag
- Head and Shoulders
- Pennant
- Rectangle
- Triangle
- Triple top
- All
- #AAPL
- #AMZN
- #Bitcoin
- #EBAY
- #FB
- #GOOG
- #INTC
- #KO
- #MA
- #MCD
- #MSFT
- #NTDOY
- #PEP
- #TSLA
- #TWTR
- AUDCAD
- AUDCHF
- AUDJPY
- AUDUSD
- EURCAD
- EURCHF
- EURGBP
- EURJPY
- EURNZD
- EURRUB
- EURUSD
- GBPAUD
- GBPCHF
- GBPJPY
- GBPUSD
- GOLD
- NZDCAD
- NZDCHF
- NZDJPY
- NZDUSD
- SILVER
- USDCAD
- USDCHF
- USDJPY
- USDRUB
- All
- M5
- M15
- M30
- H1
- D1
- All
- Buy
- Sale
- All
- 1
- 2
- 3
- 4
- 5
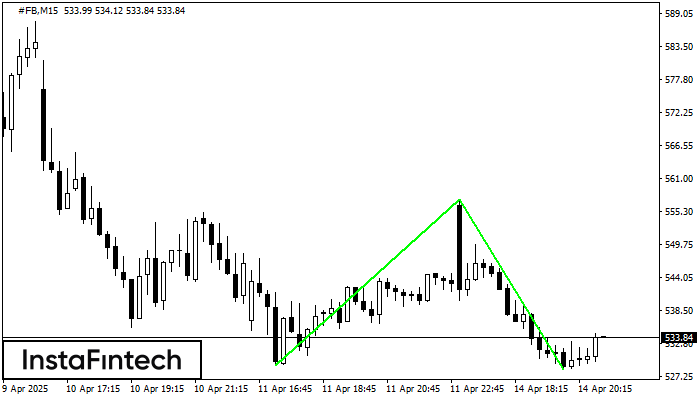
The Double Bottom pattern has been formed on #FB M15. Characteristics: the support level 529.17; the resistance level 557.42; the width of the pattern 2825 points. If the resistance level
The M5 and M15 time frames may have more false entry points.
Open chart in a new window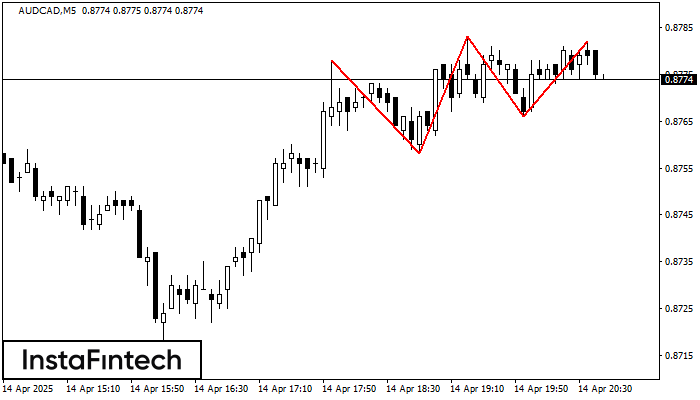
The Triple Top pattern has formed on the chart of the AUDCAD M5 trading instrument. It is a reversal pattern featuring the following characteristics: resistance level -4, support level -8
The M5 and M15 time frames may have more false entry points.
Open chart in a new window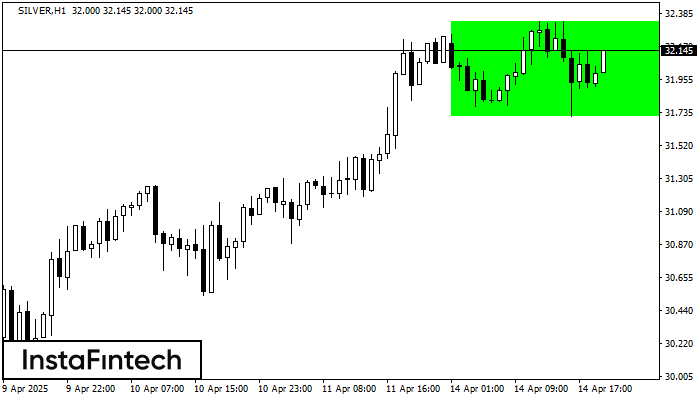
According to the chart of H1, SILVER formed the Bullish Rectangle. The pattern indicates a trend continuation. The upper border is 32.34, the lower border is 31.71. The signal means
Open chart in a new window


