empty
 
 
15.11.2024 03:31 AM
Overview of EUR/USD on November 15; The Euro Remains at Rock Bottom

This image is no longer relevant

The EUR/USD currency pair continued its downward trend on Thursday. Nearly every analysis begins with the same statement because nothing has fundamentally changed in the market. The euro depreciates rapidly, losing 50-60 pips almost daily. In our view, this collapse cannot be attributed to a single event or even multiple factors. We maintain that the market had long priced in the entire cycle of monetary policy easing, and once fully accounted for, the reverse reaction began. Simply put, the dollar fell for too long and unjustifiably, and now we are witnessing a logical correction, even though there are no immediate catalysts.

On Thursday, two reports were released in the Eurozone that contributed to the euro's decline. Currently, the market doesn't need local macroeconomic or fundamental reasons to sell the euro and buy the dollar. However, when such reasons exist, the trend accelerates. The second estimate of GDP for Q3 in the Eurozone remained unchanged from the first, at +0.4%. While this may seem like a solid number, comparing it to U.S. GDP paints a starkly different picture. Since the euro competes against the dollar, it's logical to compare the European economy's state to the U.S. economy's, where the euro consistently falls short.

Industrial production volumes, as usual, also declined. This time, the contraction was -2%, while the market had anticipated a more optimistic -1.4% year-over-year. Thus, the euro once again had no grounds for growth on Thursday. Although losses were insignificant during the day, pauses in a downtrend are normal. Corrections within a downtrend are also expected. Therefore, if the euro doesn't exhibit a sharp drop on a particular day, this doesn't mean the downtrend has ended.

In just a month and a half, the euro has lost 650 pips. Before this, it gained 1,600 pips over nearly two years. It's clear where the trend lies and where the correction occurred. Based on this understanding, we anticipate a further decline in the euro. Our near-term target range remains $1.02–$1.04, a forecast we've held since the beginning of the year. In the long term, the euro could easily return to parity with the dollar. If the global downtrend persists, the euro may fall significantly below parity, but such a scenario would require substantial new fundamental drivers.

This image is no longer relevant

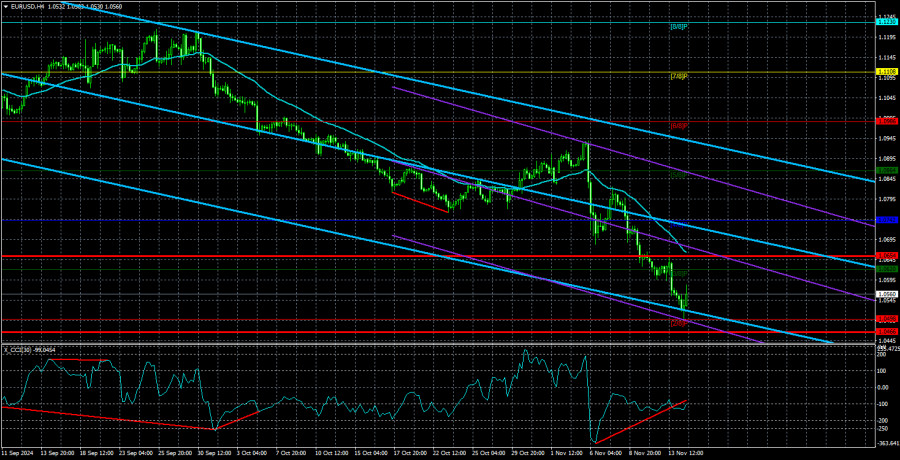
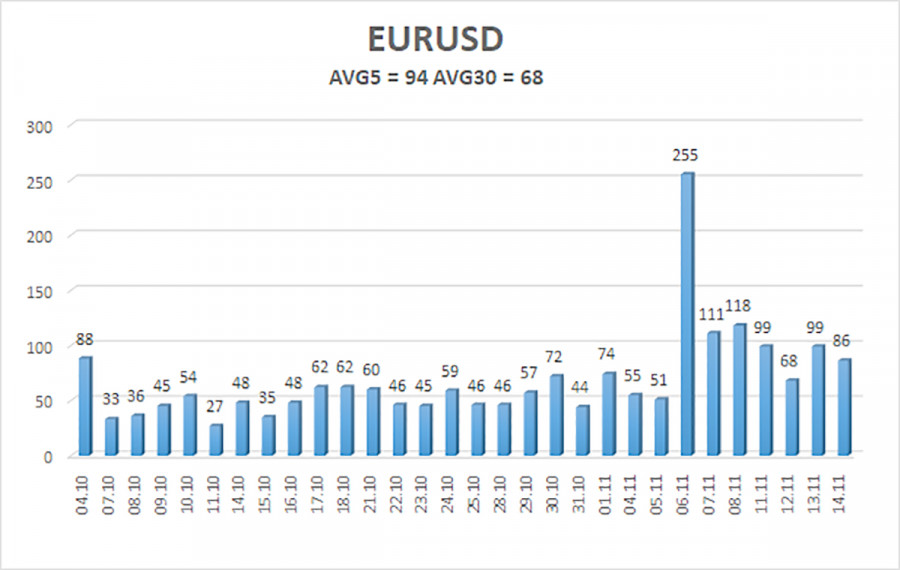
The average volatility for EUR/USD over the last five trading days as of November 15 is 94 pips, categorized as "high." On Friday, we expect the pair to move between 1.0466 and 1.0654. The higher linear regression channel is pointed downward, maintaining the global bearish trend. The CCI indicator has recently dipped into oversold territory, signaling the start of a correction, but that correction has been weak and already concluded. A new bullish divergence has now formed.

Key Support Levels:

  • S1: 1.0498
  • S2: 1.0376
  • S3: 1.0254

Key Resistance Levels:

  • R1: 1.0620
  • R2: 1.0742
  • R3: 1.0864

Trading Recommendations:

The EUR/USD pair continues its downward movement. For months, we've maintained that a decline in the euro is the most likely scenario in the medium term, fully supporting the bearish trend. Likely, the market has already priced in all or nearly all future Fed rate cuts. If this is true, the dollar has little reason for a medium-term decline, although it hasn't had many reasons to fall in the past. Short positions remain relevant with targets at 1.0466 and 1.0376 as long as the price stays below the moving average. For those trading solely based on technical setups, long positions could be considered if the price rises above the moving average, targeting 1.0742 and 1.0864, but we currently advise against long positions.

Explanation of Illustrations:

Linear Regression Channels help determine the current trend. If both channels are aligned, it indicates a strong trend.

Moving Average Line (settings: 20,0, smoothed) defines the short-term trend and guides the trading direction.

Murray Levels act as target levels for movements and corrections.

Volatility Levels (red lines) represent the likely price range for the pair over the next 24 hours based on current volatility readings.

CCI Indicator: If it enters the oversold region (below -250) or overbought region (above +250), it signals an impending trend reversal in the opposite direction.

Gana con los cambios en el valor de las criptomonedas con InstaForex.
Descarga MetaTrader 4 y abre tu primera operación.
  • Grand Choice
    Contest by
    InstaForex
    InstaForex always strives to help you
    fulfill your biggest dreams.
    UNIRSE AL CONCURSO
  • Depósito al azar
    ¡Haga un depósito en su cuenta de $3,000 y obtenga $10000 más!
    ¡En Enero, sorteamos $10000 dentro de la campaña Depósito afortunado!
    Obtenga la oportunidad de ganar depositando $3,000 en una cuenta de operaciones. Tras haber cumplido esta condición, se convertirá en un participante de la campaña.
    UNIRSE AL CONCURSO
  • Opere de forma inteligente, gane un dispositivo
    Recargue su cuenta con al menos $500, regístrese en el concurso y tenga la oportunidad de ganar dispositivos móviles.
    UNIRSE AL CONCURSO
  • 100% de bonificación
    Su oportunidad única de obtener un bono del 100 % en su depósito
    OBTENER BONO
  • 55% de bonificación
    Solicite un bono del 55% en cada depósito
    OBTENER BONO
  • 30% de bonificación
    Reciba un bono del 30% cada vez que recargue su cuenta
    OBTENER BONO

Recommended Stories

¿No puede hablar ahora mismo?
Ingrese su pregunta en el chat.
Widget callback