empty
06.11.2023 06:29 AM
BITCOIN: Technical analysis of the situation

Bitcoin

This image is no longer relevant

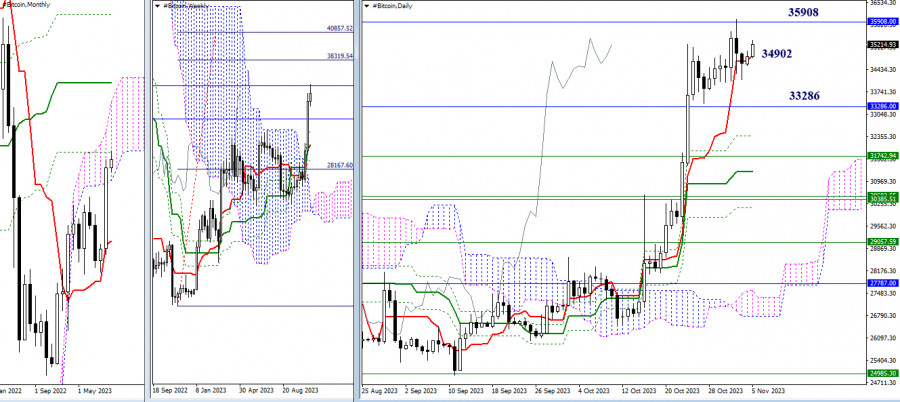
Higher timeframes

October provided bulls with moments of optimism, pushing the market away from the support of the monthly short-term trend towards the next resistance of the monthly death cross (35,908). Meanwhile, Bitcoin managed to close October within the monthly cloud (33,286), making the upper boundary of the Ichimoku cloud (40,490) the next upward target on this timeframe.

The result of October's activity was also the formation of an upward target for breaking the weekly cloud (38,320 - 40,858). These target levels (38,320 - 40,490 - 40,858) have been planned by the bullish players for November following the optimism and activity of October. This will only be possible if the bulls maintain and continue the October sentiment.

If priorities change and the bears return to the market. In that case, their focus will first be on exiting the monthly cloud (33,286) and then testing and liquidating the existing golden crosses of Ichimoku on the weekly and daily timeframes. The nearest supports from the golden crosses of Ichimoku at the moment can be noted at 32,380 - 31,743 - 31,261.

This image is no longer relevant

H4 - H1

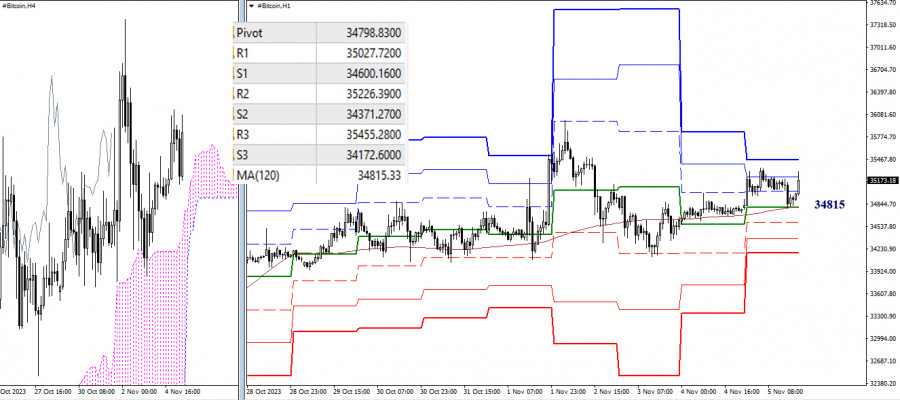
As of writing, the main advantage on the lower timeframes remains with the bullish players. However, the balance of power is very fragile because the weekly long-term trend (34,815) has been acting as support for a long time, responsible for the distribution and balance of power. Bitcoin can lose this support at any moment, after which the market's attention will shift within the day to the supports of the classic pivot points. The primary priority in this case will be the strengthening of bearish sentiments.

Note that the loss of the key level of the lower timeframes—34,815 (weekly long-term trend), is currently associated with losing the center of attraction of the daily timeframe—34,902 (short-term trend). A secure consolidation below 34,902 - 34,815 opens up new prospects for bears, both within the day and on the higher timeframes.

***

The technical analysis of the situation uses:

Higher timeframes - Ichimoku Kinko Hyo (9.26.52) + Fibo Kijun levels

H1 - Pivot Points (classic) + Moving Average 120 (weekly long-term trend)

เลือกช่วงเวลา
5
นาที
15
นาที
30
นาที
1
ชั่วโมง
4
ชั่วโมง
1
วัน
1
สัปดาห์
รับผลกำไรจากการเปลี่ยนแปลงอัตราสกุลเงินดิจิทัลกับ InstaForex.
ดาวน์โหลด MetaTrader 4 และเปิดการซื้อขายครั้งแรกของคุณ.
  • Grand Choice
    Contest by
    InstaForex
    InstaForex always strives to help you
    fulfill your biggest dreams.
    เข้าร่วมการแข่งขัน


บทความแนะนำ

การทำนายค่าเงิน GBP/USD สำหรับวันที่ 28 มีนาคม 2025

แม้ว่าข้อมูลจากสหรัฐฯ จะแสดงให้เห็นถึงการเติบโตที่ 2.4% ซึ่งสูงกว่าที่คาดการณ์ไว้ที่ 2.3% แต่ดัชนีดอลลาร์กลับลดลง 0.28% ด้วยเหตุนี้เงินปอนด์จึงพุ่งขึ้น 78 pips เกือบแตะที่เป้าหมาย 1.3001 ตัวชี้วัด Marlin ในกรอบเวลารายวันกลับมาอยู่ในพื้นที่บวก

Laurie Bailey 04:01 2025-03-28 UTC+2

การพยากรณ์ USD/JPY สำหรับวันที่ 28 มีนาคม 2025

เมื่อวานนี้ Donald Trump ได้ลงนามในคำสั่งฝ่ายบริหารให้กำหนดภาษี 25% สำหรับยานยนต์และชิ้นส่วนยานยนต์ที่นำเข้าไปยังสหรัฐอเมริกา ภาษีสำหรับยานยนต์จะเริ่มมีผลบังคับใช้ในวันที่ 3 เมษายน และสำหรับชิ้นส่วนจะเริ่มในวันที่ 3 พฤษภาคม หลังจากมีข่าวนี้ ค่าเงินเยนอ่อนตัวลง 0.18%

Laurie Bailey 04:01 2025-03-28 UTC+2

สัญญาณการซื้อขายสำหรับคู่เงิน EUR/USD ระหว่างวันที่ 27-29 มีนาคม 2025: ซื้อเมื่อเหนือระดับ 1.0790 (21 SMA - 8/8 Murray)

หากค่าเงินยูโรยังคงฟื้นตัวและสามารถยืนเหนือระดับ 1.0790 ในชั่วโมงถัดไปได้ เราอาจคาดว่า EUR/USD จะยังคงปรับตัวขึ้นต่อไปได้ ดังนั้นเครื่องมือการเงินนี้อาจแตะที่ +2/8 มาร์เรย์ ที่ระดับ 1.0986 ในระยะสั้น และอาจถึงระดับจิตวิทยาที่ 1.10 ด้วย

Dimitrios Zappas 13:55 2025-03-27 UTC+2

สัญญาณการเทรดสำหรับ GOLD (XAU/USD) วันที่ 27-29 มีนาคม 2025: ขายต่ำกว่า $3,057 (ดับเบิลท็อป - 7/8 Murray)

ในช่วงเริ่มต้นของเซสชั่นอเมริกา ราคาทองคำซื้อขายอยู่ที่ประมาณ 3,051 และสูงกว่าระดับ 7/8 ของ Murray โดยมีการขึ้นสูงสุดตลอดกาลที่ 3,057 ทองคำอาจพยายามทะลุระดับสูงที่เคยถึงเมื่อวันที่ 18 มีนาคม หากราคาสามารถยืนเหนือระดับ 7/8

Dimitrios Zappas 13:54 2025-03-27 UTC+2

การพยากรณ์อัตราแลกเปลี่ยนวันที่ 27/03/2025: EUR/USD, USD/JPY, USDX และ Bitcoin

ลิงก์ที่เป็นประโยชน์: บทความอื่น ๆ ของฉันสามารถเข้าถึงได้ในส่วนนี้ หลักสูตร InstaForex สำหรับผู้เริ่มต้น การวิเคราะห์ที่เป็นที่นิยม เปิดบัญชีเทรด สำคัญ: ผู้เริ่มต้นในการซื้อขายฟอเร็กซ์จำเป็นต้องระมัดระวังอย่างมากเมื่อทำการตัดสินใจเรื่องการเข้าสู่ตลาด ก่อนการประกาศรายงานสำคัญต่าง ๆ ควรหลีกเลี่ยงการเข้าไปในตลาดเพื่อป้องกันการเผชิญกับความผันผวนที่เกิดขึ้นอย่างฉับพลันเนื่องจากความผันผวนที่เพิ่มขึ้น หากคุณตัดสินใจทำการซื้อขายในช่วงที่มีการประกาศข่าว

Sebastian Seliga 11:24 2025-03-27 UTC+2

EUR/USD – 27 มีนาคม: ดอลลาร์แข็งค่าขึ้นอย่างค่อยเป็นค่อยไป

ในวันพุธ คู่สกุลเงิน EUR/USD ยังคงลดลงอย่างต่อเนื่อง โดยหยุดลงบริเวณระดับการย้อนกลับของฟิโบนัชชีที่ 161.8% ที่ 1.0734 การดีดกลับจากระดับนี้ทำให้คู่สกุลเงินฟื้นตัวขึ้นมาที่โซนแนวรับ 1.0781–1.0797 แต่การดีดกลับอีกครั้งจากโซนนี้เปิดโอกาสให้การลดลงต่อไปที่มีโอกาสปิดที่ต่ำกว่า 1.0734 ในทางกลับกัน การรวมตัวขึ้นไปเหนือโซน 1.0781–1.0797

Samir Klishi 10:37 2025-03-27 UTC+2

GBP/USD – 27 มีนาคม: อัตราเงินเฟ้อทำให้ค่าเงินปอนด์อ่อนตัวลง

บนกราฟรายชั่วโมง คู่สกุลเงิน GBP/USD ยังคงปรับตัวลดลงในวันพุธ โดยเกือบจะถึงระดับ 1.2865 และพลาดเพียงไม่กี่จุดเท่านั้น นอกจากนี้ไม่มีการเด้งกลับจากระดับ 1.2931 ในวันนี้ แม้ว่าราคาได้เข้าใกล้มาก ด้วยเหตุนี้ การลดลงอาจเริ่มต้นอีกครั้งไปสู่ระดับ 1.2865 การทะลุเหนือระดับ

Samir Klishi 10:19 2025-03-27 UTC+2

AUD/USD: การเริ่มต้นของภาษีในวันที่ 2 เมษายนอาจกดดันคู่สกุลเงินนี้

ค่าเงินดอลลาร์ออสเตรเลียยังคงอยู่ในช่วงของการรวมตัว โดยมีการเคลื่อนไหวในช่วงแคบ ๆ ระหว่าง 0.6265–0.6325 การที่ทรัมป์กำลังจะนำภาษีมาใช้กับจีนและสินค้าจากออสเตรเลียบางประเภท ทำให้ผู้เข้าร่วมตลาดต้องระมัดระวังอย่างมาก ส่งผลให้คู่เงินคู่นี้ยังคงอยู่ในช่วงการรวมตัว ในแง่ของเทคนิค ยังคงมีการซื้อขายภายในช่วง ราคาไม่แน่นอนเนื่องจากผลกระทบเบื้องต้นของภาษีสหรัฐฯ และมาตรการตอบโต้ที่อาจเกิดขึ้นจากประเทศที่ได้รับผลกระทบยังไม่ชัดเจน คู่เงินนี้มีแนวโน้มที่จะเคลื่อนไหวในช่วง 0.6265–0.6325 จนถึงสิ้นสัปดาห์นี้

Pati Gani 09:08 2025-03-27 UTC+2

#NDX – ภาพรวมการวิเคราะห์ทางเทคนิค

การชะลอตัวที่ระดับแนวโน้มระยะสั้นรายเดือน (19730) กระตุ้นให้กลุ่มขาขึ้นพยายามกลับมาตั้งหลักอีกครั้ง ผลที่ได้คือเกิดช่องว่างขาขึ้นเมื่อเริ่มต้นสัปดาห์การซื้อขายใหม่ โดยมีการทดสอบระดับแนวต้านรายสัปดาห์ที่ 20302 หากระดับนี้ถูกทะลุ ตลาดจะเผชิญกับโซนแนวต้านรายสัปดาห์เพิ่มเติมอีกสองแห่งที่สูงขึ้นเล็กน้อย (20669 – 21036) อย่างไรก็ตาม หากกลุ่มขาขึ้นสูญเสียกำลังในระหว่างการทดสอบใหม่ ภายฝ่ายค้านสามารถนำตลาดกลับไปยังโซนแรงโน้มถ่วงรอบ Tenkan

Evangelos Poulakis 04:45 2025-03-27 UTC+2

สัญญาณการซื้อขายสำหรับ EUR/USD ระหว่างวันที่ 26-28 มีนาคม 2025: ขายต่ำกว่า 1.0808 (21 SMA - 8/8 Murray)

ในช่วงเช้าของเซสชันอเมริกา คู่เงิน EUR/USD กำลังซื้อขายอยู่ที่ประมาณ 1.0786 ต่ำกว่าค่า 21SMA โดยเครื่องมือนี้กำลังตามแนวโน้มขาลง ครั้งหนึ่งเคยขึ้นสูงถึง 1.0940 EUR/USD ได้ลดต่ำลงหลายเซสชันติดต่อกัน ยุโรปอาจยังคงลดลงต่อไป ซึ่งเราสามารถมองหาโอกาสในการขายต่ำกว่า 21SMA

Dimitrios Zappas 15:13 2025-03-26 UTC+2
หากไม่สะดวกคุยในตอนนี้
ระบุคำถามไว้ได้ใน แชท.
Widget callback
 

Dear visitor,

Your IP address shows that you are currently located in the USA. If you are a resident of the United States, you are prohibited from using the services of InstaFintech Group including online trading, online transfers, deposit/withdrawal of funds, etc.

If you think you are seeing this message by mistake and your location is not the US, kindly proceed to the website. Otherwise, you must leave the website in order to comply with government restrictions.

Why does your IP address show your location as the USA?

  • - you are using a VPN provided by a hosting company based in the United States;
  • - your IP does not have proper WHOIS records;
  • - an error occurred in the WHOIS geolocation database.

Please confirm whether you are a US resident or not by clicking the relevant button below. If you choose the wrong option, being a US resident, you will not be able to open an account with InstaForex anyway.

We are sorry for any inconvenience caused by this message.