


signal strength 2 of 5
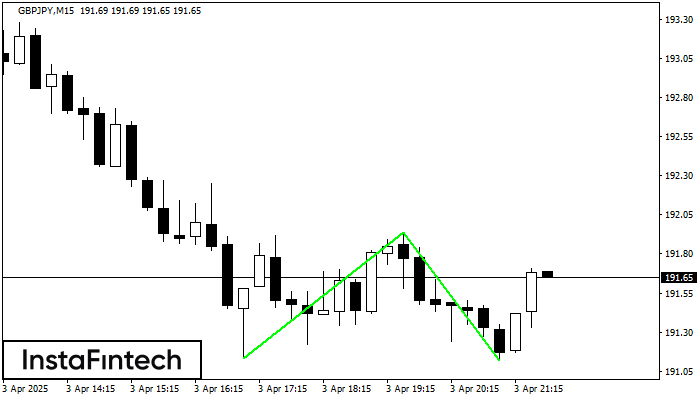
The Double Bottom pattern has been formed on GBPJPY M15. Characteristics: the support level 191.13; the resistance level 191.94; the width of the pattern 81 points. If the resistance level is broken, a change in the trend can be predicted with the first target point lying at the distance of 82 points.
The M5 and M15 time frames may have more false entry points.
ดูเพิ่มเติม
- All
- Double Top
- Flag
- Head and Shoulders
- Pennant
- Rectangle
- Triangle
- Triple top
- All
- #AAPL
- #AMZN
- #Bitcoin
- #EBAY
- #FB
- #GOOG
- #INTC
- #KO
- #MA
- #MCD
- #MSFT
- #NTDOY
- #PEP
- #TSLA
- #TWTR
- AUDCAD
- AUDCHF
- AUDJPY
- AUDUSD
- EURCAD
- EURCHF
- EURGBP
- EURJPY
- EURNZD
- EURRUB
- EURUSD
- GBPAUD
- GBPCHF
- GBPJPY
- GBPUSD
- GOLD
- NZDCAD
- NZDCHF
- NZDJPY
- NZDUSD
- SILVER
- USDCAD
- USDCHF
- USDJPY
- USDRUB
- All
- M5
- M15
- M30
- H1
- D1
- All
- Buy
- Sale
- All
- 1
- 2
- 3
- 4
- 5
was formed on 09.04 at 05:25:03 (UTC+0)
signal strength 1 of 5
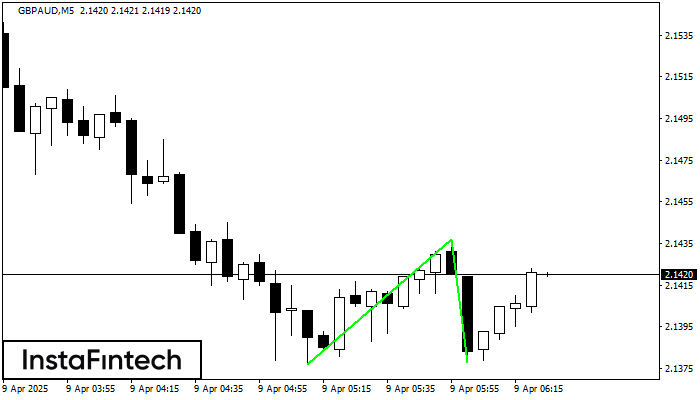
รูปแบบ รูปแบบกราฟจุดสองยอดขาลง (Double Bottom) ถูกสร้างขึ้นมาใน GBPAUD M5 การก่อตัวเช่นนี้แสดงถึงการย้อนตัวของแนวโน้มจากด้านล่าง ขึ้นมายังด้านบน สัญญาณแสดงให้เห็นถึง การเทรดแบบการซื้อที่ควรเปิด หลังจากที่มีการเคลื่อนตัวทะลุผ่านขอบเขตด้านบนของรูปแบบ 2.1437 การเคลื่อนไหวต่อจากนั้นจะอยู่ในความกว้างของรูปแบบปัจจุบัน
ขอบเตระยะเวลาใน M5 และ M15 อาจจะมีตำแหน่งการเข้าใช้งานที่ผิดพลาดมากยิ่งขึ้น
Open chart in a new windowwas formed on 09.04 at 05:02:18 (UTC+0)
signal strength 1 of 5
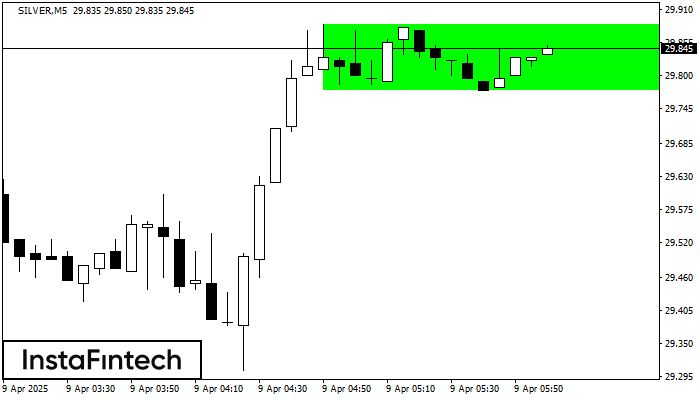
อ้างอิงจากชาร์ตของ M5, SILVER ที่ได้สร้างรูปแบบ รูปแบบกราฟสี่เหลี่ยมผืนผ้าขาขึ้น (Bullish Rectangle) ออกมา ซึ่งเป็นรูปแบบของความต่อเนื่องในแนวโน้ม รูปแบบนี้จะอยู่ในขอบเขตตามนี้: ขอบเขตด้านล่าง 29.77 – 29.77
ขอบเตระยะเวลาใน M5 และ M15 อาจจะมีตำแหน่งการเข้าใช้งานที่ผิดพลาดมากยิ่งขึ้น
Open chart in a new windowwas formed on 09.04 at 04:04:54 (UTC+0)
signal strength 1 of 5

อ้างอิงจากชาร์ตของ M5, NZDCAD ที่ได้สร้างรูปแบบ รูปแบบกราฟหัวและหัวไหล่แบบกลับหัว (Inverse Head and Shoulder) ออกมา ระดับสูงสุดของตำแหน่งหัวอยู่ที่ 0.7878 ในขณะที่เส้นระดับกลางของแนวคอ จะอยู่ที่ 0.7826/0.7858
ขอบเตระยะเวลาใน M5 และ M15 อาจจะมีตำแหน่งการเข้าใช้งานที่ผิดพลาดมากยิ่งขึ้น
Open chart in a new window


